
Realtor.com ran a piece this week on the new Census Bureau income figures that deserves more attention than it will get in an election week. The national median household income reached $84,780 in 2025, up roughly 3.8% from 2024, according to the American Community Survey data the bureau released Thursday. That is real progress for households. It did almost nothing for homeownership.
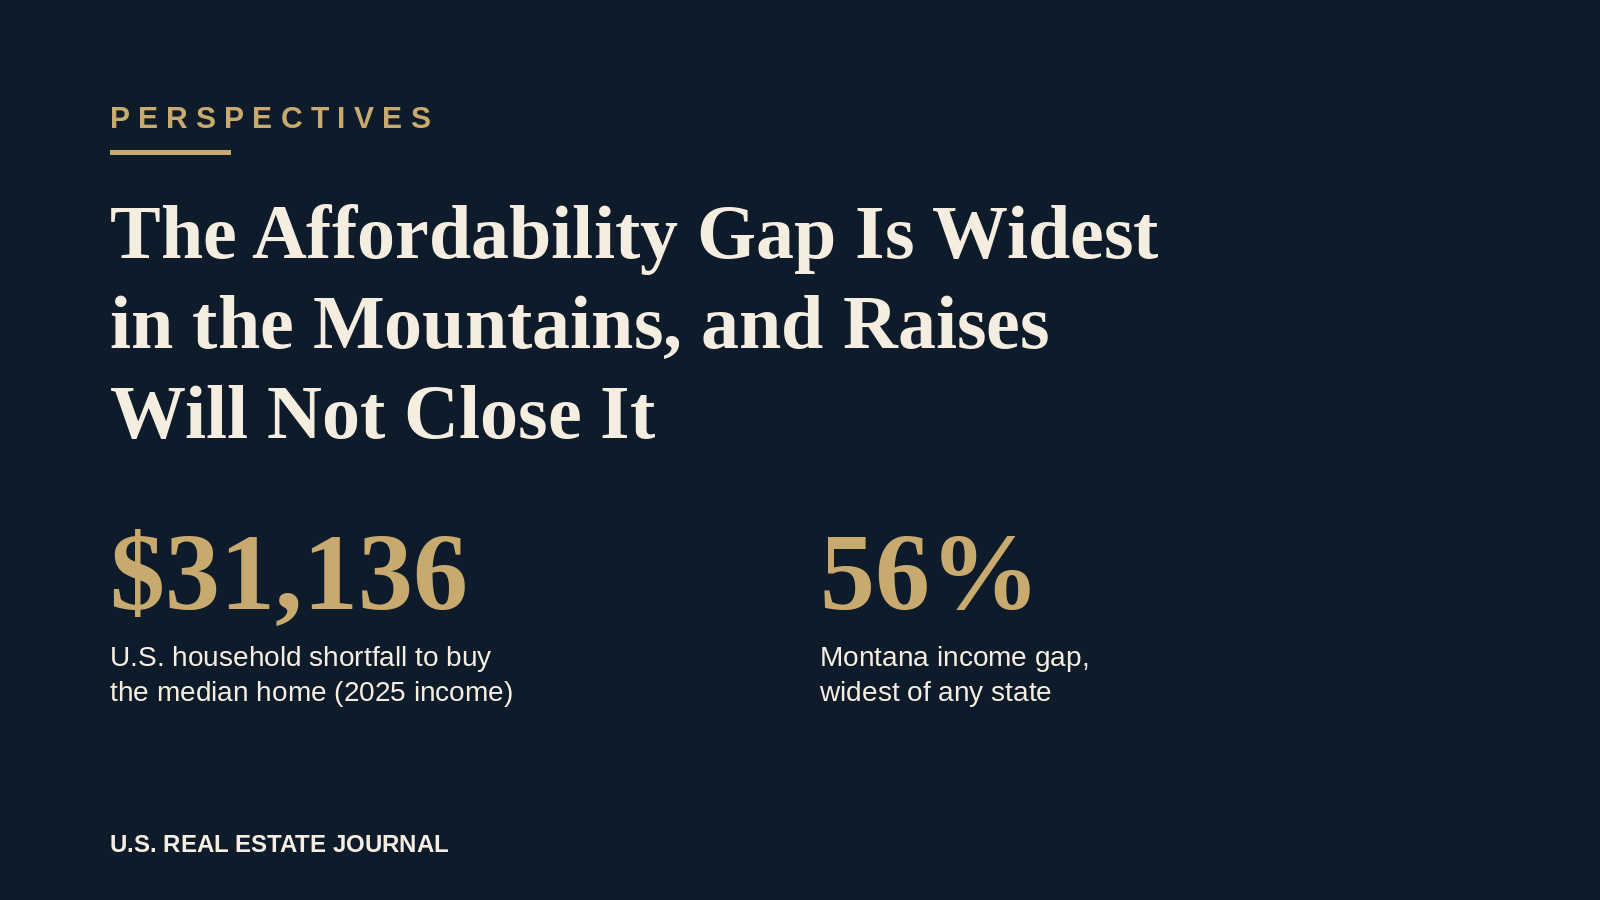
Using Realtor.com’s own model, the typical household earned about 27%, or $31,136, less than it would need to buy a home at September’s national median listing price of $419,250. A year earlier the gap was about 24%. Incomes went up, prices went down in most places, and affordability still got worse.
Rates did the damage, not prices
Realtor.com senior economist Hannah Jones lays out the explanation plainly. Home prices fell year over year in 40 of the 50 states in September, and incomes rose, so she attributes the deterioration almost entirely to mortgage rates, which climbed more than a full point over the year. The model assumes a 7.32% rate, 10% down, 1.7% a year for taxes and insurance, and the familiar rule that housing should take no more than 30% of gross income.
Freddie Mac’s latest survey, as reported by Realtor.com, offers a little relief, with the 30-year fixed averaging 7.24% for the week ending October 29, against 6.17% a year ago. But the same report notes that CME FedWatch puts the odds of a December rate hike near 80% after the Fed held at 3.75% to 4%. I would not underwrite a rescue from the rate side. When the shortfall is driven by the cost of money, a 3.8% raise is a rounding error.
The number that should stop people is this one: under Realtor.com’s method, there is no state where a median income household can buy the median priced home without becoming cost burdened. The gap runs from 2.9% to 56.1%.
The Midwest is close, the mountains are not
At the near end, Iowa is the most affordable state for a second year. Its typical household earned $78,483, only $2,287 short of the income needed for a $284,900 median home. Illinois, Pennsylvania, Ohio and Kansas all sit within 3.5% to 4.9% of the line. These are markets where a modest rate move, or a builder willing to deliver product at the right price point, puts ownership back within reach. A Des Moines mortgage originator quoted by Realtor.com estimates that a one point rate drop on a $300,000 loan saves about $200 a month. In Iowa, that nearly closes the gap. In much of the West, it barely dents it.
At the far end is Montana, which ranks last. The typical household there earns $77,099, roughly $99,000 below the income needed to finance the state’s $635,000 median home. Montana’s median income is lower than Iowa’s, while its median home costs more than twice as much. California at 49%, Idaho at 48.6%, Hawaii at 48.2% and New York at 46.7% follow.
When a state’s median home costs twice Iowa’s on a lower median income, no raise and no rate cut closes that gap.
Montana and Idaho near the bottom of that list are what I think of as the mountain version of the K shaped housing economy. Demand is set by people whose wealth was earned somewhere else, and wages are set by the local service and trades economy. Those two numbers were never going to match, and now they do not come close.
What the broker on the ground is describing
The most useful part of the Realtor.com piece is a Montana broker’s explanation of why supply cannot respond. Materials are shipped in from out of state, construction labor is short in every region, winter cuts the building season, and impact fees stack on top. That describes a market where the cost to deliver a new house, not just the price of an existing one, sits above what local wages support.
The consequence is spillover. He describes buyers leaving Bozeman for Belgrade, Manhattan and Three Forks. That is the classic gateway town pattern: the workforce moves out along the highway until the commute breaks, and then employers start losing people. He also makes a point I agree with completely, that affordability targets pegged at 60% or 80% of area median income are often still out of reach for working households. In resort and gateway towns, area median income is itself pulled up by the same outside wealth that pulled up prices.
Who is positioned, and what could break
I see opportunity in two places. First, Midwestern and Rust Belt markets where the gap is a few percentage points. Builders and developers who can deliver entry-level product there are selling into real, income supported demand, not demand that depends on rates falling. Second, employer anchored workforce housing in mountain and resort markets, where hospitals, school districts, resorts and local governments have a direct operating reason to secure housing for staff. In those projects the employer, not the open market buyer, is the one with a reason to make the numbers work, and land and entitlement become the scarce inputs.
The risks are just as clear. In the near affordable states, growing demand has already pushed prices up and eroded some of the advantage, as Jones notes. In mountain markets, any project that assumes median income buyers will qualify at today’s rates is underwriting to a household that does not exist. And if a December hike pushes mortgage rates back up, the affordability picture moves the wrong way again with no help from incomes.
There is also something the headline misses. Realtor.com’s weekly data shows inventory up 8% from a year ago, new listings down 1.5% and the median asking price down 1.4% to $414,000. More homes on the market and slightly lower prices are not turning into more owners, because the pool of buyers who qualify at the median keeps shrinking.
What we are watching next
At Kaufman & Company we are watching four things. Whether December brings a hike, and how mortgage rates respond. Whether Midwest price growth starts to outrun local incomes. Whether mountain counties ease impact fees and permitting, which the Montana broker calls a catch-22 because more development changes the character people moved there for. And whether more employers in gateway towns decide that housing is part of their payroll cost, because in many of these places it already is.
For anyone following land, entitlement and housing pressure in resort and mountain markets, LandBriefing’s Mountain Watch tracks those towns with a free watchlist and ongoing coverage.
Sources
- Mapped: Where Incomes Rose Fastest in 2025, and Why Many Still Can’t Afford a Home, Realtor.com, October 29, 2026
- Mortgage Rates Drop to 1-Month Low, Offering Buyers Relief Ahead of Midterm Elections, Realtor.com, October 29, 2026