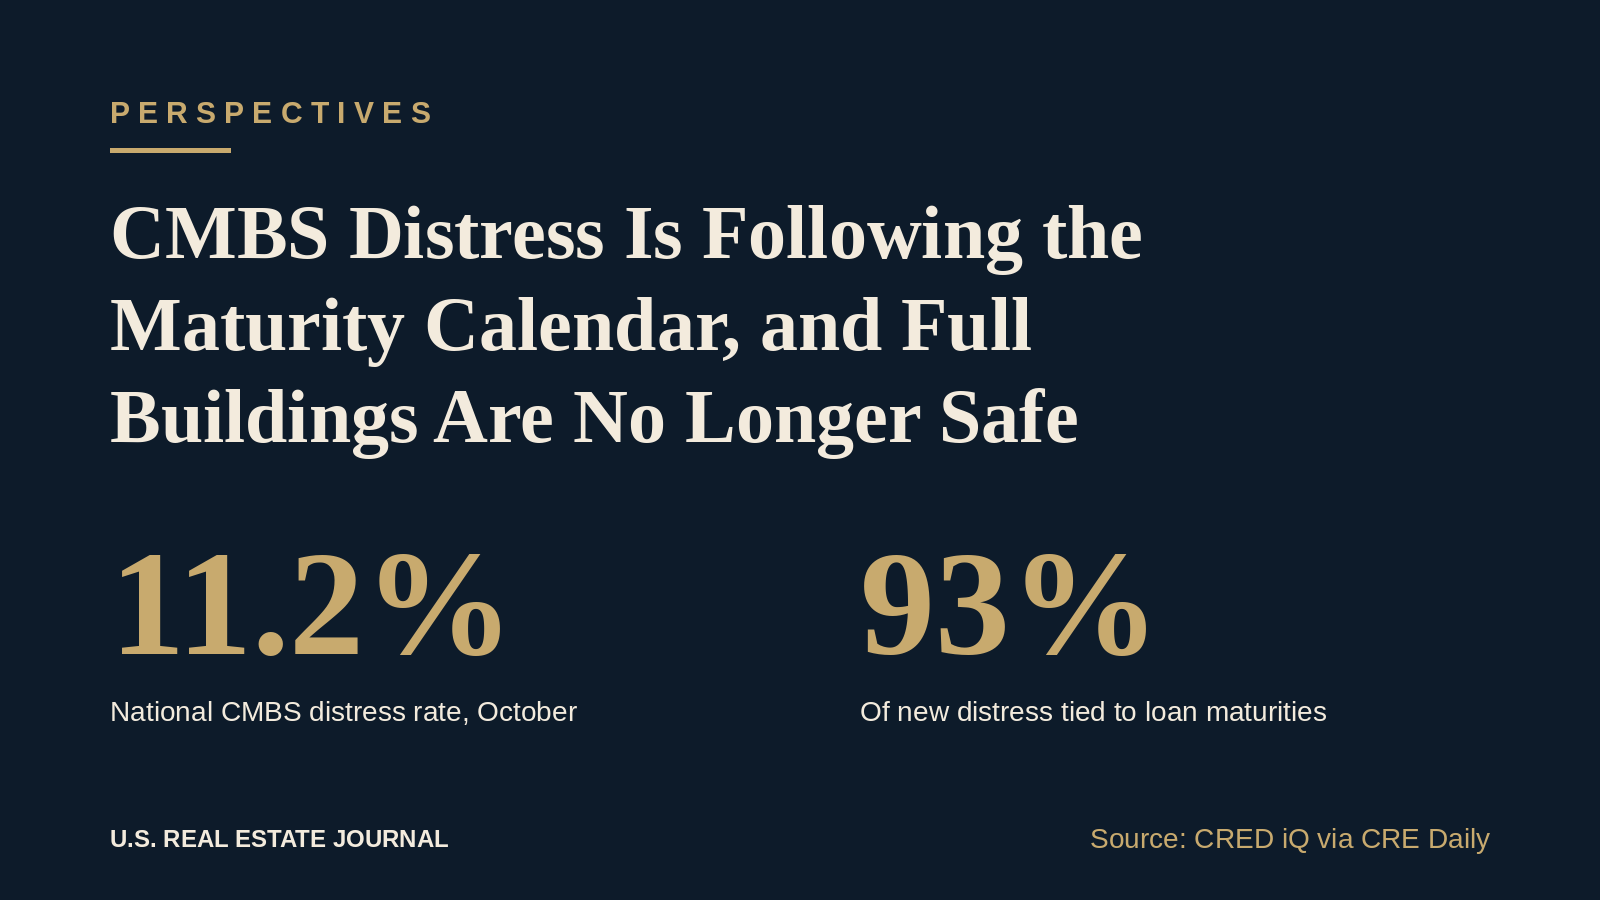

The most useful number in commercial real estate this week is not the distress rate. It is the reason behind it. According to CRED iQ data reported by CRE Daily, the national CMBS distress rate rose to 11.2% in October, up from 10.9% a year earlier. Of the $4.5 billion in debt that became newly distressed during the month, 93% was tied to loans at or nearing maturity.
That tells me this is no longer mainly a story about empty buildings. It is a story about loans written for a world of cheap money coming due in a world that is not. The 10 year Treasury closed October 30 at roughly 4.93%, according to the market snapshot in the same CRE Daily newsletter. Refinancing at that level, against values that have reset lower, is where the math is breaking.
Occupancy Is No Longer a Defense
Two examples in the CRE Daily report should make every owner and lender uncomfortable. Philadelphia’s 2400 Market Street, reported at 99.5% occupied, entered special servicing on its $205 million loan. Fresno Fashion Fair, at 97.6% occupancy, became delinquent on $325 million of debt. These are not distressed buildings in the operational sense. They are leased, functioning assets whose capital structures no longer fit.
For years the standard defense in a credit committee was simple: the building is full, the tenants pay, the loan will be fine. That defense quietly assumed the exit. When a loan matures, the lender is not asking whether the building works. It is asking whether today’s value and today’s rates support the balance. A full building carrying debt sized at prepandemic values and a low fixed coupon can fail that test without losing a single tenant.
Leasing is the operating question. The maturity date is the capital question, and right now it is the one deciding outcomes.
The Map Is Moving
The geography is shifting too. CRED iQ shows New York improving to 11.2%, while Los Angeles jumped from 9.4% to 14.6% and Houston climbed to 15.3%. Chicago sits at 23.5%, the highest of the major metros, with Philadelphia close behind at 23.0%. Office remains the core of the problem. Office distress is 16.4% nationally and accounts for 44% of all distressed CMBS debt, with office rates of 32.6% in Chicago, 31.5% in Houston and 21.5% in Los Angeles.
Houston is worth pausing on. It is a growth market by almost any population or jobs measure, and it still carries one of the worst office distress rates in the country. That is a reminder I come back to often: metro growth does not rescue a bad capital structure, and it does not rescue the wrong product type. Data over emotion means separating the market story from the asset story.
Trepp’s separate October numbers, also covered by CRE Daily, point the same way beneath a calmer headline. Trepp’s overall CMBS delinquency rate slipped 15 basis points to 7.87%, but much of that came from a single $975 million showroom loan returning to current. Retail rose 63 basis points to 7.21%, office rose to 12.33%, the highest of any property type, and multifamily edged up to 8.09%. Three of the five major property types got worse. The two firms measure different things, so I would not compare their figures directly, but the direction is consistent.
Who Is Positioned, and Who Is Exposed
The opportunity is real, but it is narrower than the headlines suggest. In a maturity driven cycle, the groups positioned to win are the ones with patient equity, modest leverage and the operating ability to take a sound asset with a broken balance sheet and recapitalize it. When the underlying real estate is performing, the problem being solved is a capital problem rather than a leasing problem, and that is a very different risk to take on. Lenders and special servicers working through these files will need counterparties who can actually close and execute.
The exposure is concentrated. CRE CLOs issued in 2021 and 2022 carry a 34.8% distress rate in the CRED iQ figures, which is where short term floating debt met peak pricing. Borrowers who bought extensions to wait for lower rates are running out of runway. And retail, which many investors had filed away as stabilized, is showing up again, with $700 million of newly distressed retail debt in October in the CRED iQ data, alongside $1.1 billion in hotels and $500 million in industrial.
What the headline misses is that a maturity wave does not resolve in one month or one quarter. Extensions push problems forward. Cures like the showroom loan make a monthly rate look better without changing the underlying pressure. I expect the data to stay noisy, with good months and bad months, while the overall direction is set by how much debt still has to roll at today’s rates.
What We Are Watching Next
At Kaufman & Company we are watching three things. First, the share of new distress tied to maturity rather than to payment default. As long as it stays near the 93% CRED iQ reported, this is a refinance problem, and refinance problems respond to rates and recapitalization more than to leasing. Second, the gap between the 10 year Treasury and the coupons borrowers locked in before rates rose, because that gap is the size of the hole. Third, whether distress keeps migrating into well occupied assets outside office, especially retail and multifamily, where many owners still assume they are safe.
The practical lesson for operators is to underwrite the maturity date as seriously as the rent roll. If a loan comes due in the next two years, the time to plan the recapitalization is now, while there are still options on the table.
For more on how we think about distressed assets, development and turnaround situations, visit Kaufman Real Estate and Consulting.
Sources
- CMBS Distress Climbs to 11.2% as Strain Shifts From New York to L.A. and Chicago, CRE Daily, November 2, 2026
- CMBS Delinquency Rate Dips to 7.87% as Retail Jumps 63 bps, CRE Daily, November 3, 2026